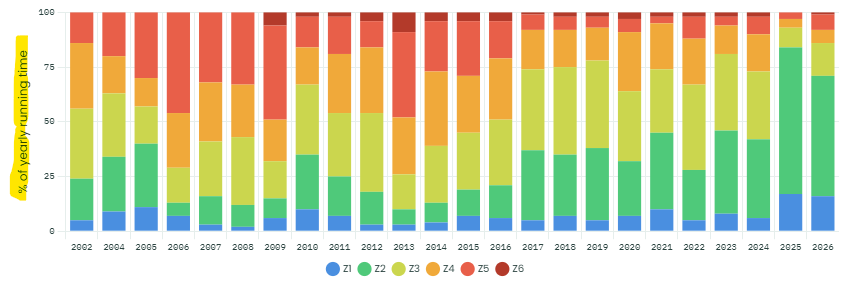
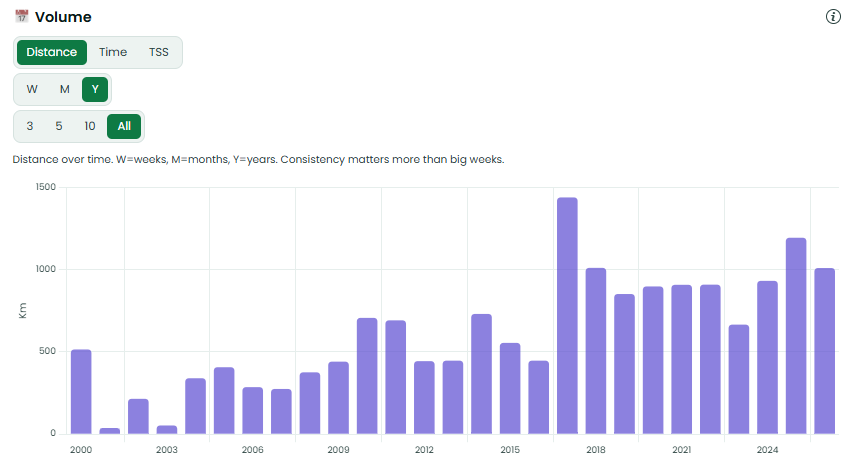
Would it be useful to have a selector for the Y-axis on this graph, so that you can flip between:
- % of yearly running time (current)
- Yearly running time (a stacked bar for each year with colours for zones)
- Yearly running distance (a stacked bar for each year with colours for zones)
I.e. basically a combination of the above graph and this Volume graph with HR zones:
Or if combining 2 graphs isnt great, maybe move the Temperature card/graph just below Volume, so that both are visible on the screen at the same time? (more useful on a PC than viewing on a phone)
Thanks for the suggestion, logged as a feature request. The yearly zone chart under Heart Rate Trends currently shows each zone as a percentage of that year’s running time. A time or distance view per year, and moving the Temperature card next to the Volume card, are both reasonable changes.
I can’t promise a date. Votes on the topic help prioritise it.
Update: this is now live. The yearly zone chart under Heart Rate Trends has a % / Time / Distance switch, and you can tap the legend to show one or more zones. Moving the Temperature card next to Volume isn’t done yet.
Claude